Data Comics for Reporting Controlled User Studies in Human-Computer Interaction
Selected Projects | | Links: Project Website
Data Comics for Reporting Controlled User Studies in Human-Computer Interaction Zezhong Wang, Jacob Ritchie, Jingtao Zhou, Fanny Chevalier, Benjamin Bach IEEE Transactions on Visualization and Computer Graphics (TVCG) 2021 (IEEE VIS, 2020)) 📄PDF
Video Preview (24sec)
Inspired by data comics, this paper introduces a novel format for reporting controlled studies in the domain of human-computer interaction (HCI). While many studies in HCI follow similar steps in explaining hypotheses, laying out a study design, and reporting results, many of these decisions are buried in blocks of dense scientific text. We propose leveraging data comics as study reports to provide an open and glanceable view of studies by tightly integrating text and images, illustrating design decisions and key insights visually, resulting in visual narratives that can be compelling to non-scientists and researchers alike. Use cases of data comics study reports range from illustrations for non-scientific audiences to graphical abstracts, study summaries, technical talks, textbooks, teaching, blogs, supplementary submission material, and inclusion in scientific articles. This paper provides examples of data comics study reports alongside a graphical repertoire of examples, embedded in a framework of guidelines for creating comics reports which were iterated upon and evaluated through a series of collaborative design sessions.
Example
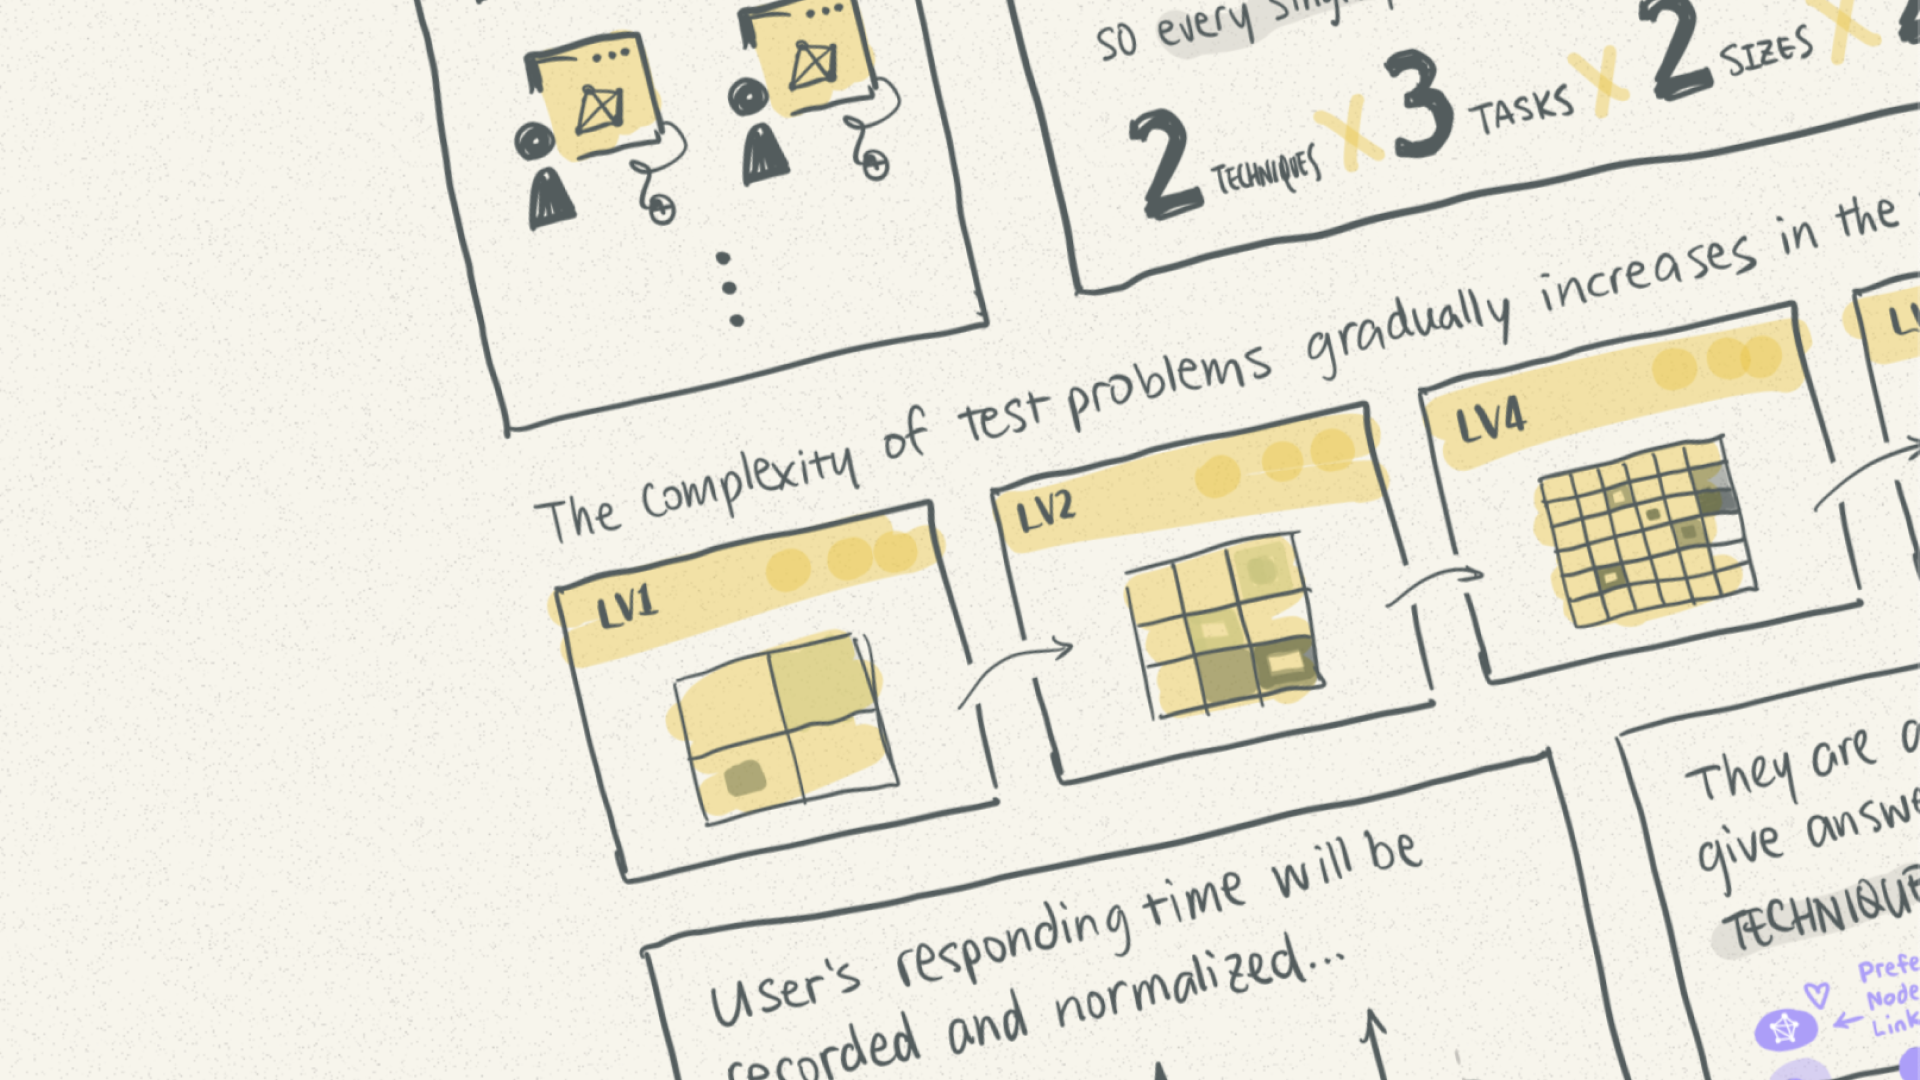
Data comic for 📄Weighted Graph Comparison Techniques for Brain Connectivity Analysis.

Comic created by Jingtao Zhou.