Data Comics for Climate Change
Selected Projects | | Links: Project Website
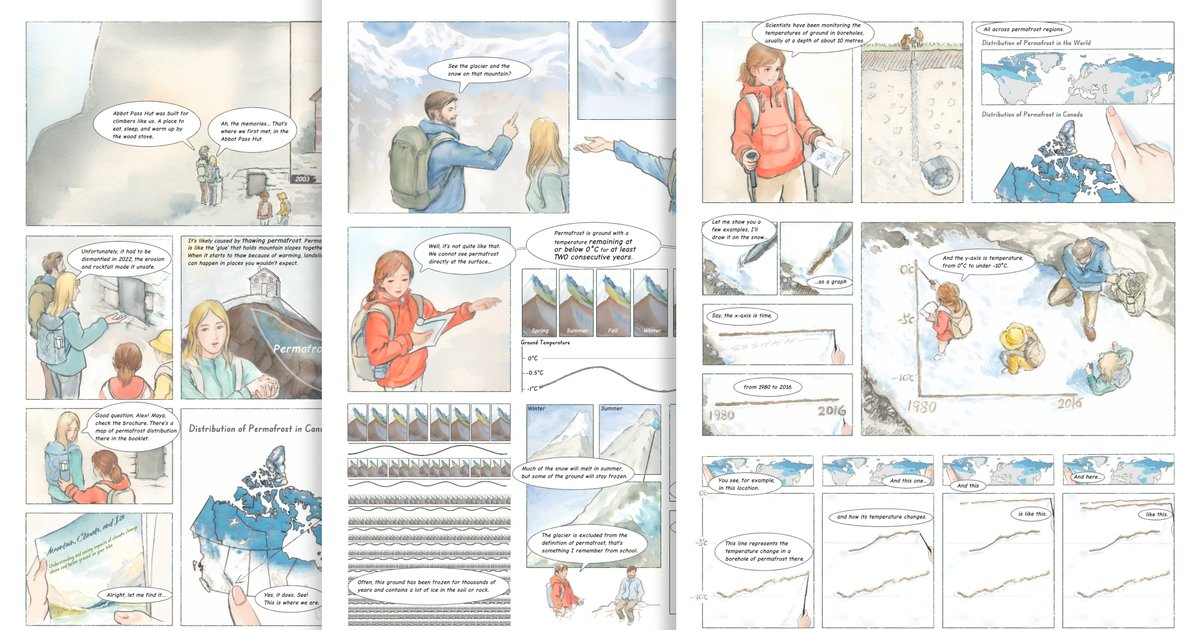
While there is a gap between what the general public and policymakers understand about science and what is known by experts, this gap is particularly perilous regarding climate change. Climate change is increasingly recognized as a paramount threat to life on the planet.
The most recent report from the Intergovernmental Panel on Climate Change highlights the extreme and worsening impacts of climate change, including rising sea levels, heatwaves, drought, flooding, regional food, and water shortages, storm damage, and more.
Scientists are generating massive amounts of data about climate change and developing significant understandings of the causal factors, wide-ranging projected impacts, and necessary mitigation and adaptation strategies. To know how to respond and make changes both policymakers and the general public need to be better supported to develop actionable comprehension. Currently, scientists inform each other via expert publications and conferences. We, as part of the public and policymakers, receive our information via the media and the web – and in our current catastrophic blending of information with misinformation, we are at risk of well-intentionally taking ineffective or even harmful actions and decisions. We need the best and most current scientific information in an easily accessible format that includes data transparency and is also both scientifically informed and verified.
To close this gap, we (with Dr Sheelagh Carpendale, Dr Michelle Levy, and Dr Stephan Gruber) have assembled a team that includes experts in data visualization, narrative construction, data comics, and climate change. We will work collaboratively to develop climate change data comics that combine compelling narratives with comprehensible data visuals that are informed and verified by the appropriate scientists.
This project is supported by the Government of Canada’s New Frontiers in Research Fund (NFRF).
Poster presented at Graphic Interface 2023:

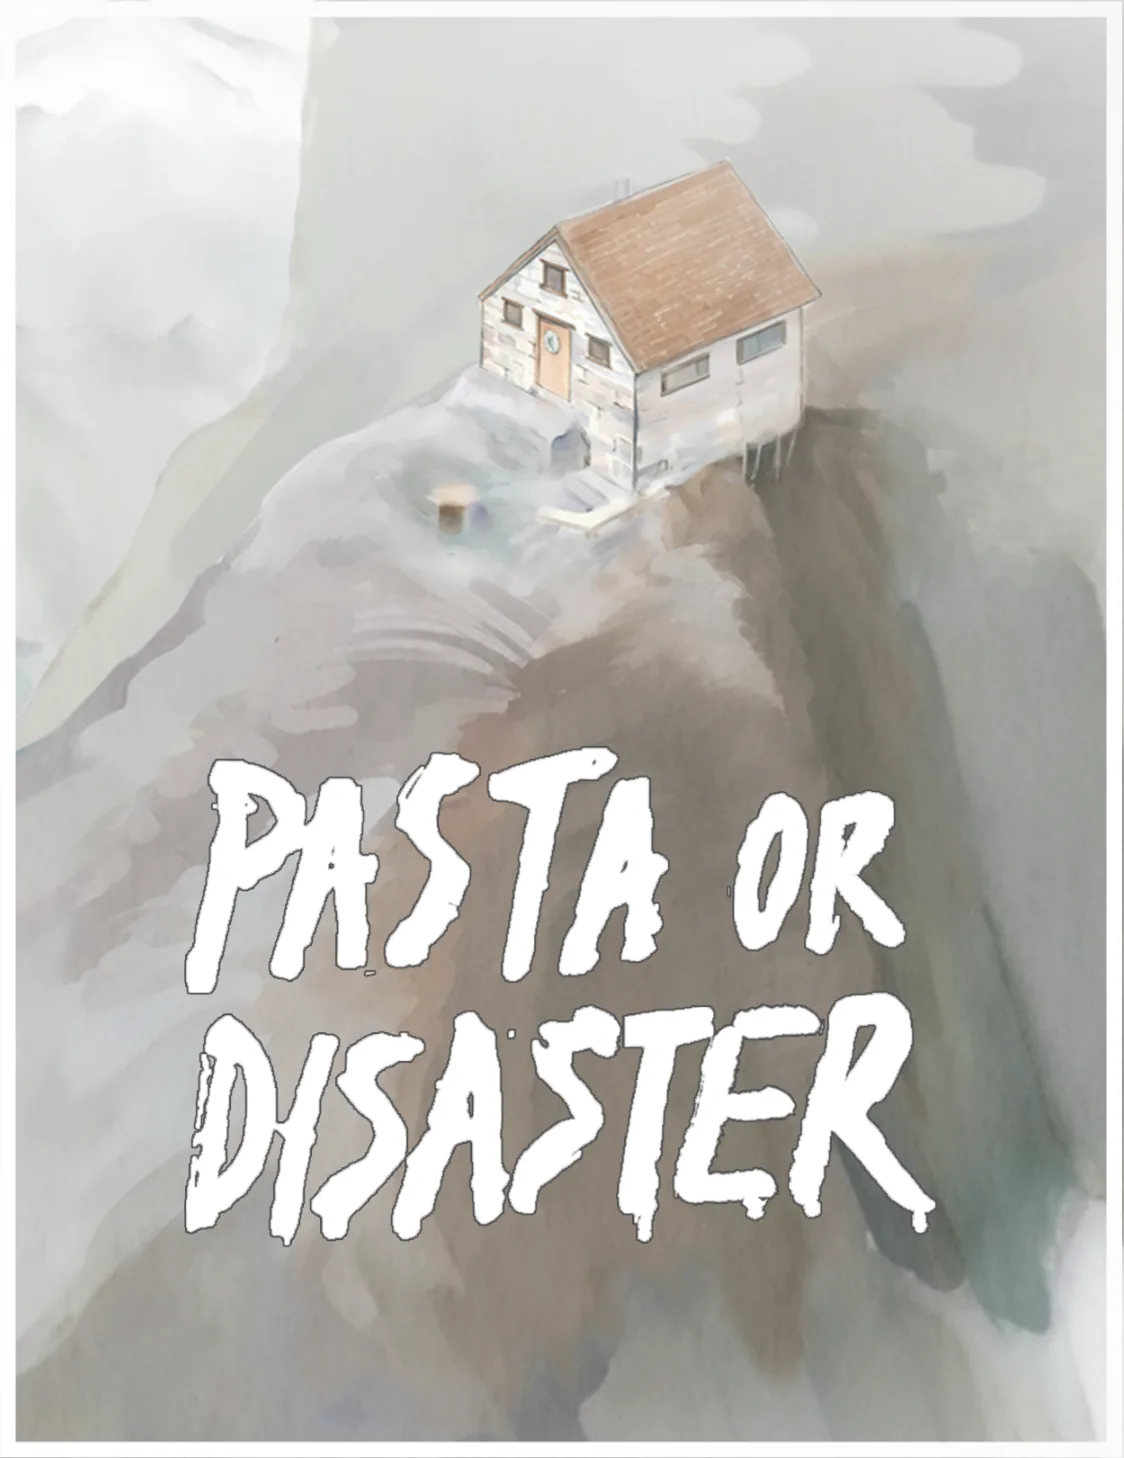
This comic was presented at a top international conference on permafrost (ICOP2024) and featured in the 2024 State of the Mountains Report.
To cite this work:
From Science to Story: Communicating Permafrost Concepts with Data Comics Zezhong Wang, Stephan Gruber, Michelle Levy, Sheelagh Carpendale. The 12th International Conference on Permafrost (ICOP2024) 📄PDF
Video Preview (2 min)
Diegetic Data Stories
Looking across two of our climate data comics, Pasta or Disaster (permafrost) and The Monster Eats Algae (eutrophication in freshwater), we articulate diegetic data stories: data stories in which empirically grounded data, visualizations, and scientific arguments are told from within a storyworld, as in-world events, characters, and conflicts, rather than through captions, sidebars, or narration addressed to the reader. The paper offers climate data communicators a vocabulary of seven design strategies on two axes.
Structural axis: moves that shape the whole story’s plot, conflict, and characters.
- Misconception-as-Conflict: a character voices a misconception or misreading, and an explainer character resolves it on stage. (Pasta or Disaster)
- Detection-as-Plot: the data investigation itself is the engine of the story; each measurement is a clue, sampling is field investigation, and visualizations are evidence assembly. (The Monster Eats Algae)
- Instrument-as-Character: each measurement modality is embodied as a character with a profession, a personality, and limits. (The Monster Eats Algae)
Explanation axis: local moves that anchor a single scientific concept in a concrete, in-world event, object, or scene, rather than in captions, sidebars, or annotated charts.
- Real-Event Grounding: the storyworld is grounded in real, documented events, named in the panels or restaged without names. (both comics)
- In-world Experiment as Demonstration: a scientific principle is shown through a relatable in-world physical experiment that doubles as a normal scene activity. (both comics)
- In-world Visualization Production: characters produce visualizations in-frame with the materials at hand, not via sidebars or captions. (both comics)
- Felt-Phenomenon Anchor: harm or mechanism is given an embodied, sensory form in the storyworld before, or instead of, being stated as a number. (both comics)
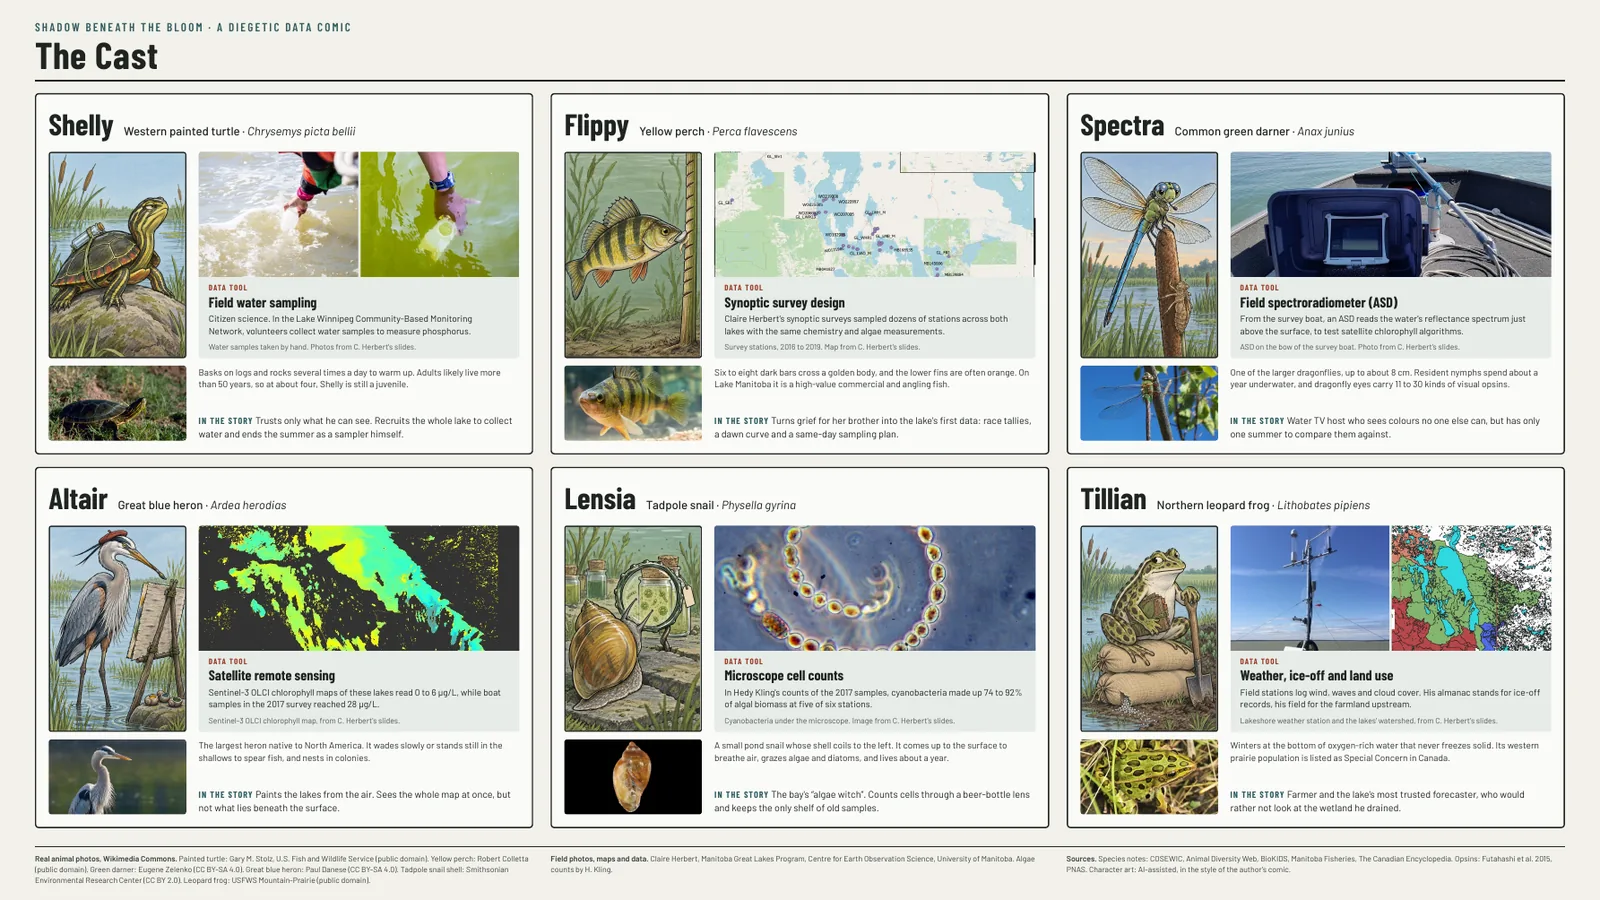
The cast of The Monster Eats Algae. Each animal of the lake is paired with one real way of measuring the Manitoba Great Lakes. Cast sheet by Zezhong Wang, CC BY-NC-ND 4.0.
To cite this work:
Diegetic Data Stories for Climate Communication Zezhong Wang, Sheelagh Carpendale. Visualising Climate 2026 📄PDF