Zezhong Wang (王澤中)
We live in a world overflowing with data — yet for many people, it still feels cold, distant, or like a language they were never taught to speak. My work grows from a simple belief: data can help people better understand the world around them and spark genuine curiosity. Blending Visual Design, Human-Computer Interaction, and Data Visualization, I explore two interlocking areas. Human-Data Interaction focuses on designing visualizations and interfaces that help people understand what’s happening, take informed action, and contest or revise how data is used. Data-Driven Storytelling is about turning data-based evidence into narratives that help non-experts connect with data in context.
I am a postdoctoral fellow at ixLab, Simon Fraser University, working with Dr. Sheelagh Carpendale. I earned my PhD from the University of Edinburgh under Dr. Benjamin Bach and Dr. Dave Murray-Rust, and received the IEEE VGTC Visualization Dissertation Award Honorable Mention 2023.
Ultimately, I am committed to ensuring data and technology work for everyone, expanding who gets to understand, question, and benefit from them.
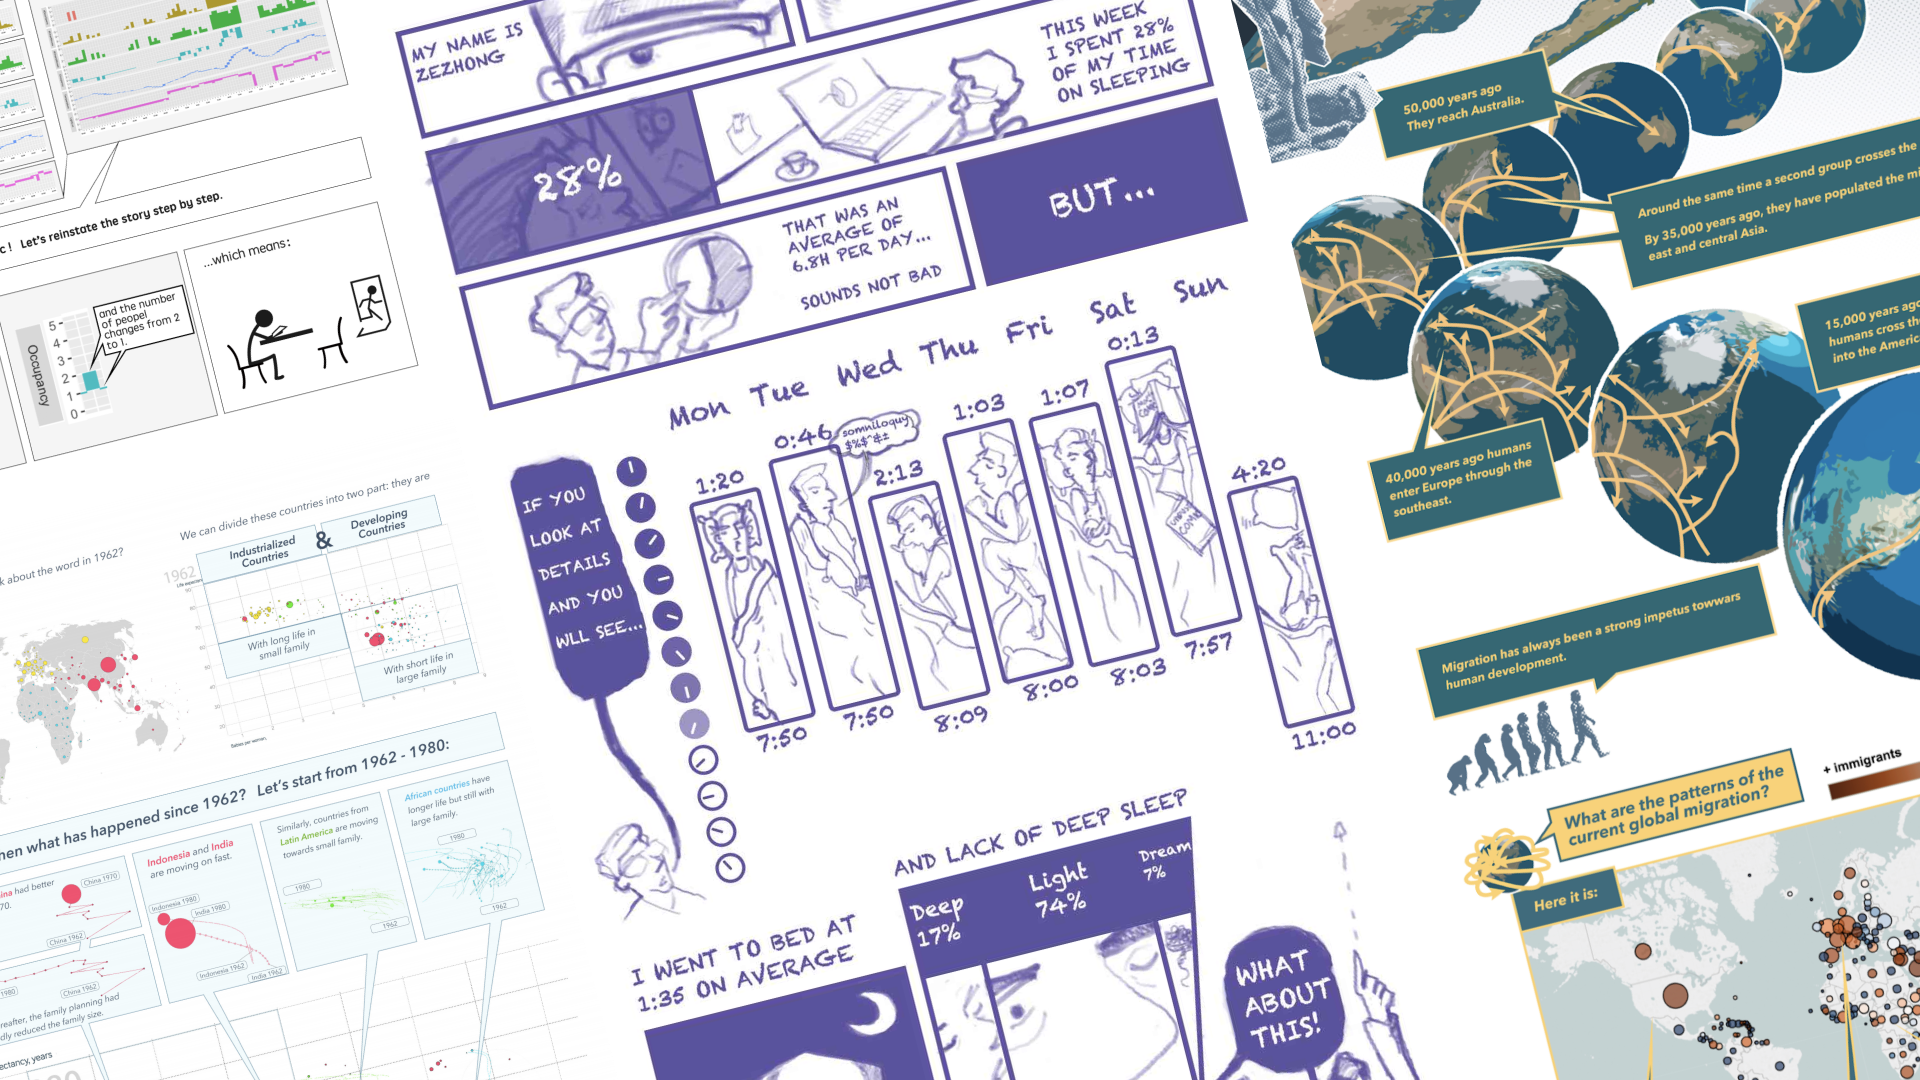
Data Comics: My Journey of Exploration
Research and design exploration of data comics as a storytelling medium and interactive interface. Continue reading Data Comics: My Journey of Exploration
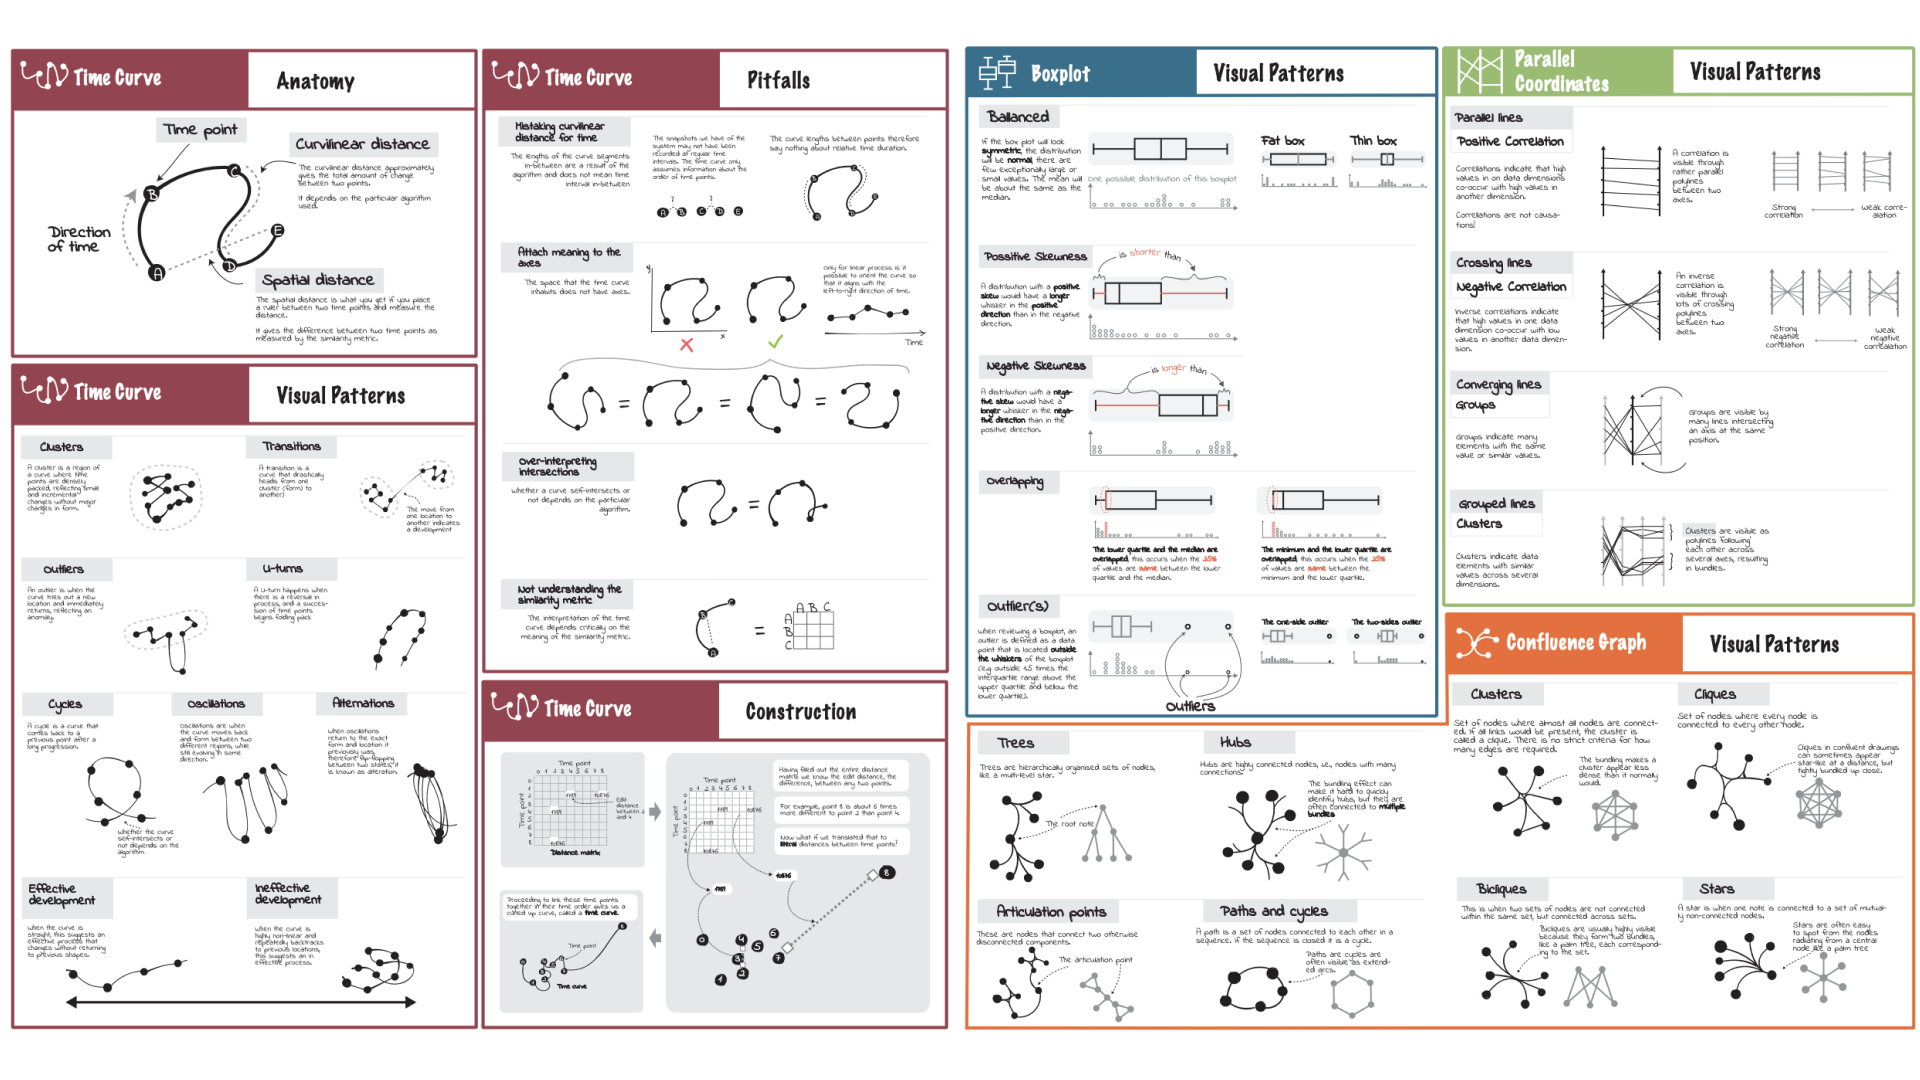
Cheat Sheets for Data Visualization Techniques
A set of concise graphical explanations to support understanding data visualization techniques Continue reading Cheat Sheets for Data Visualization Techniques
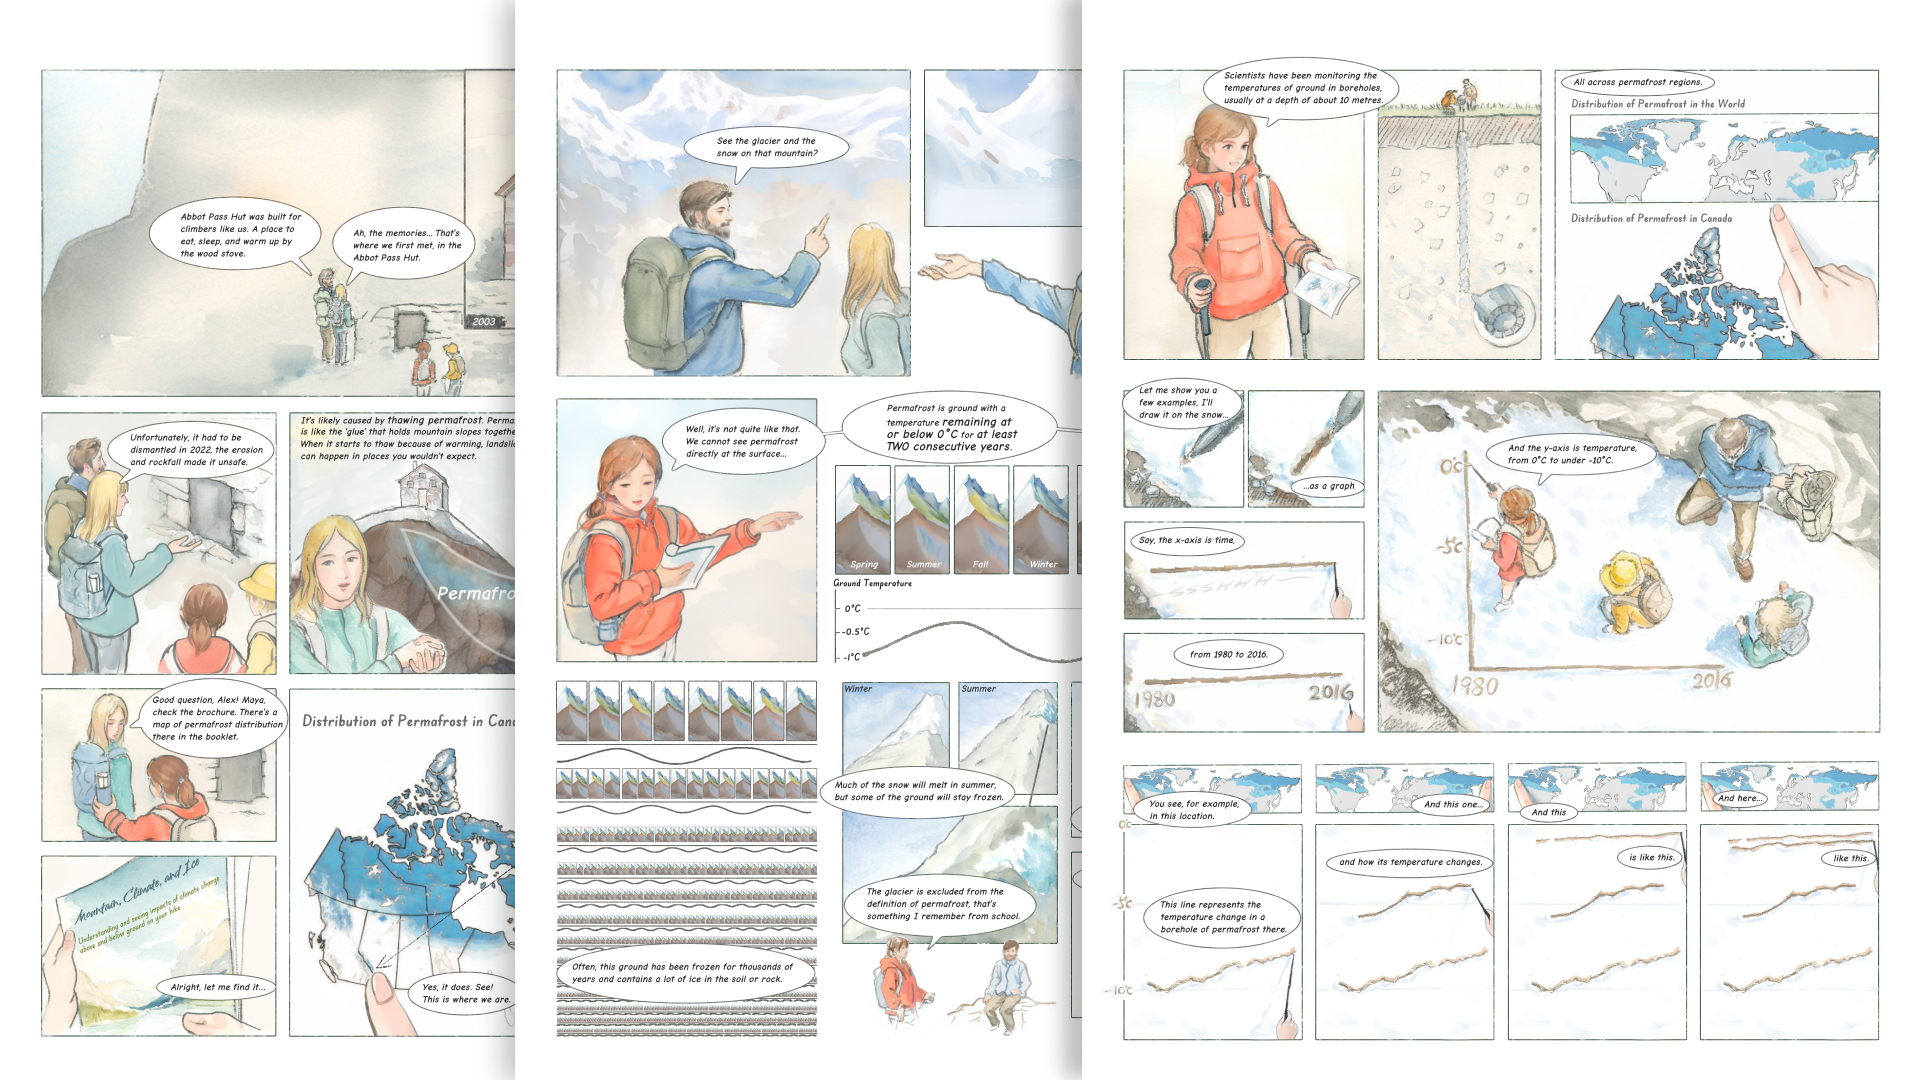
Data Comics for Climate Change
Engage the public to understand climate change with validated science and data Continue reading Data Comics for Climate Change
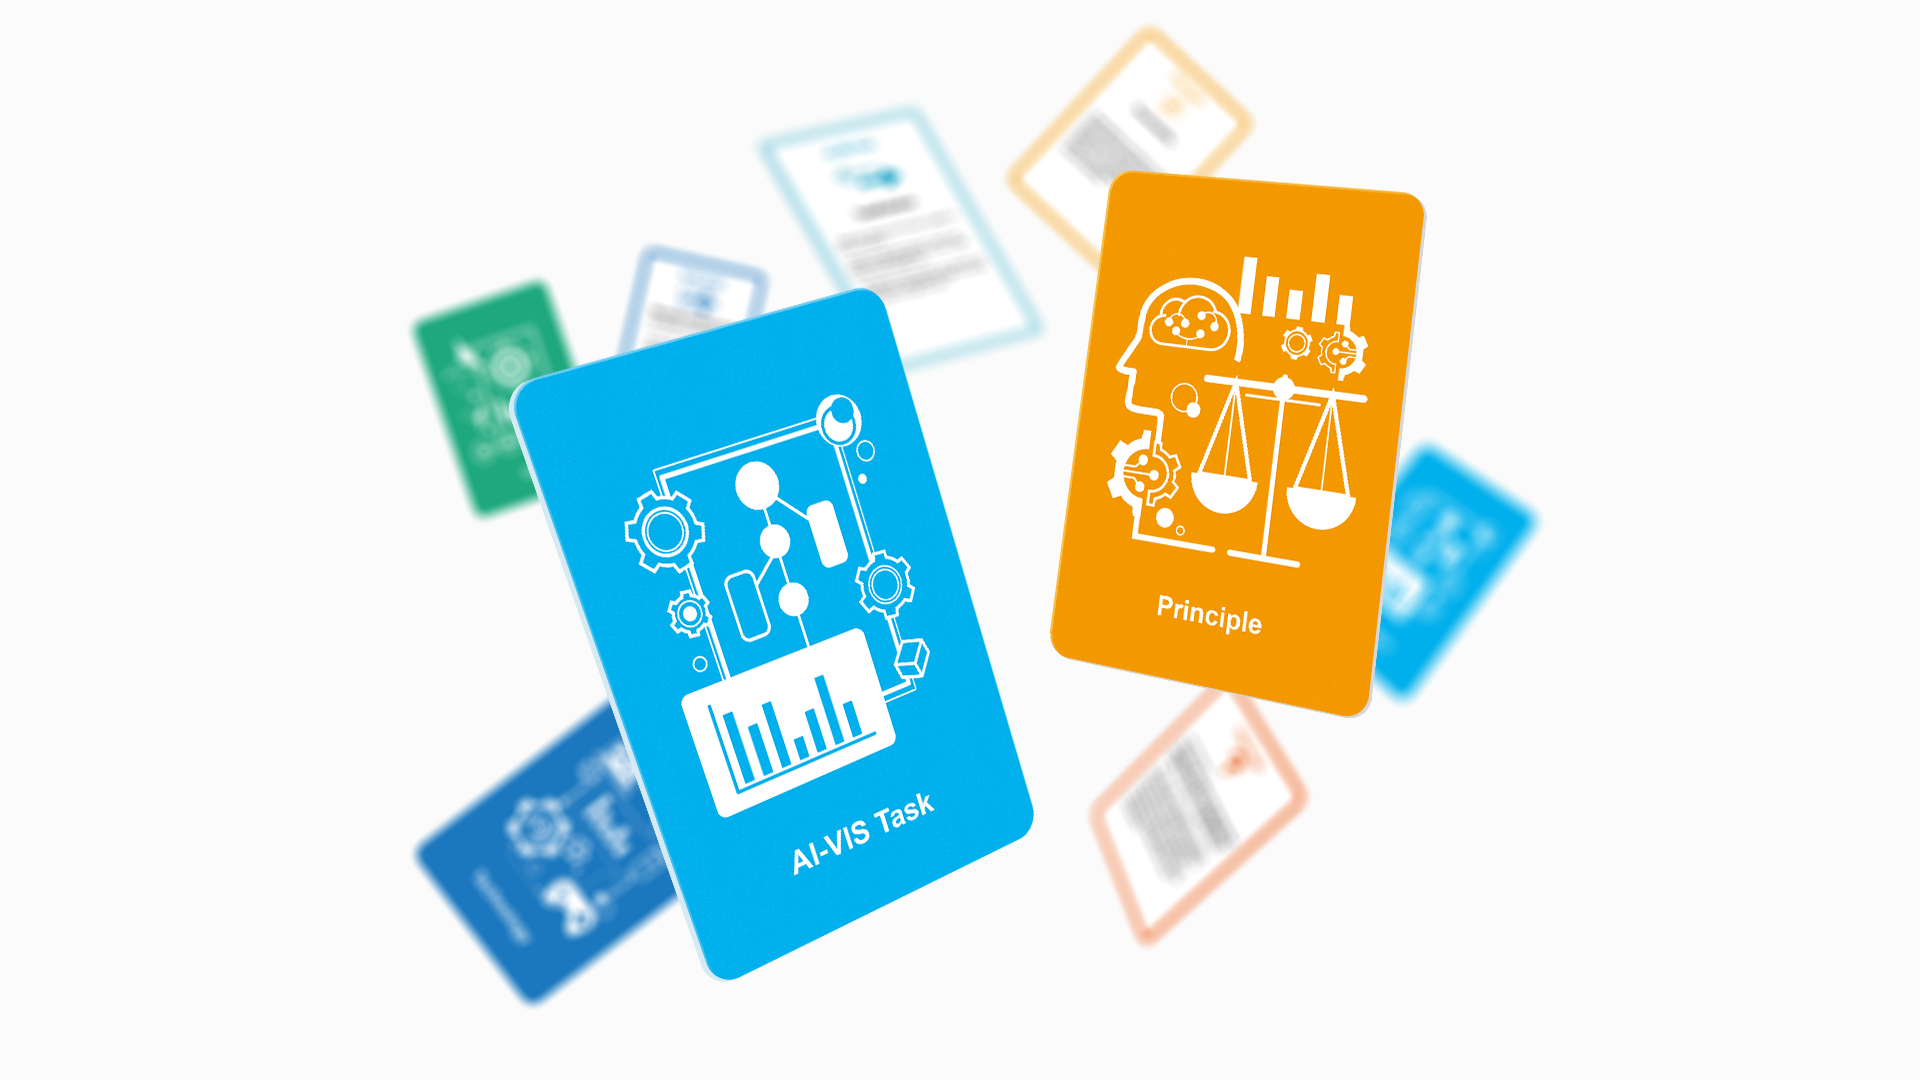
AI4VIS EthiCards
A Card-Based Approach to Exploring Ethics in AI for Data Visualization Applications Continue reading AI4VIS EthiCards
News
Paper AI4VIS EthiCards: A Card-Based Approach to Exploring Ethics in AI for Data Visualization Applications was accepted by EuroVis 2026.
I’ll present Just-in-Time Data Literacy Through Conversational Data Comics at CHI 2026 Workshop on Data Literacy.
Invited to be a member of IEEE VIS 2026 Conference program committee.
Invited to be a member of PacificVis 2026 Conference Track program committee.
Our work will be presented at IEEE VIS 2025, I couldn’t attend in person, I hope to see you next time! Flirting Charts: Expressive Motion Design in Information Visualization Inspired by Animal Courtship Performances Input Data Comics: Exploring a Narrative Approach to Input Visualization; ThreadWave: Visualizing Co-authorship as Temporal Threads (led by Ruishan Wu); Exploring Data Detective Practices as a Class Activity (led by Ruishan Wu); The Fuzzy Front Ends: Reflections on the Never-Ending Story of Visualization Co-Design (led by Wei Wei).
Co-organizer of the Visual Methods & Analyzing Visual Data in Human-Computer Interaction workshop at ISS 2024 (October 27). Also serving as Local Organization Co-Chair for ISS 2024.
Co-organizer of the Data Storytelling in an Era of Generative AI workshop at VIS 2024 (October 13).
Paper Exploring Using Personalised Comics for Healthcare Communication for Patients Living With Hemodialysis was accepted by ACM Designing Interactive Systems Conference (DIS 2024).
Paper Design Patterns for Data-Driven News Articles received the Best Paper Honourable Mention at CHI 2024.
Paper From Science to Story: Communicating Permafrost Concepts with Data Comics was accepted by the International Conference on Permafrost (ICOP 2024).
IEEE Visualization and Graphics Technical Community (VGTC) Visualization Dissertation Award Honorable Mention 2023.
Started a project Data Comics for Climate Change in the summer of 2023, with Dr Sheelagh Carpendale, Dr Michelle Levy, and Dr Stephan Gruber, supported by the Government of Canada’s New Frontiers in Research Fund (NFRF).